October 2012
When was the last time you heard someone speak well of the state of the economy or of prospects for the stock market? You can’t remember? Me neither! This might explain, at least in part, why the stock market has continued to the up-side. The markets have an uncanny ability to do the opposite of what most people expect. I’ve written about this many times: when everybody who is inclined to sell has already sold, there is little resistance to an advance.
And so it was in the third quarter of 2012 with the stock market rising 6.4%, as measured by the S&P 500. Most other market segments had attractive gains as well: mid cap (+5.4%), small cap (+5.3%), financial (+5.9%), international (+6.1%), technology (+6.8%), and healthcare (+6.9%). er attaining some of the biggest gains over the past few years, real estate stocks struggled in the third quarter, essentially breaking even. This may be a classic example of buy the rumor / sell the news. When we first bought real estate at the beginning of 2010 no one wanted to own real estate. Since then our investment has gained 85%!
Now that it appears housing may have finally turned the corner, real estate stocks have cooled. While I do consider real estate the type of investment I want to hold long term, I do continually evaluate short to intermediate term attractiveness relative to other market sectors.
This same type of thinking led me to overweight financial stocks in February, 2012. Over the next few years I expect financial stocks will outperform just as real estate did the past few years.
Bonds, though not as profitable, also gained in the third quarter. The BarCap Aggregate Bond Index, the most commonly used bond benchmark, earned 1.6%. (More on bonds below in the Tempo Performance section)
Another striking quality of the market over the past few months is that it has been relatively calm. It is almost as if this is the calm before the storm. The storm, in this case, is the Presidential election and the implications for the financial cliff (the expiration of Bush era tax cuts which will go into effect in 2013 unless the government acts sooner).
There is no question that the overwhelming perception among market professionals is that Republicans are better for the economy (and therefore the stock market) than Democrats. My job as an investment advisor is not to be either Republican or Democrat but to invest your money as effectively as I can. I try to look past politics, partisanship, and perception to reality. So I ask: have Republicans historically been better for the stock market?
Since 1953 there have been six Republican Presidents (Eisenhower, Nixon, Ford, Reagan, G.H.W. Bush, and G.W. Bush) in office for a total of 36 years and five Democratic Presidents (Kennedy, Johnson, Carter, Clinton, and Obama) in office for slightly less than 24 years. During the Republican administrations (from the day they took the oath to the day the next President took the oath) the stock market rose a total of 259.5%. During the Democratic administrations the stock market rose a total of 388.6% (through 9/30/12). So the stock market performed better under Democrats with less time in office.
The question for me is not who will occupy the White House as much as it is how our government is going to deal with the ever increasing debt as a percent of GDP. Neither tax increases (not to mention decreases) nor spending cuts alone can reduce our debt – it will take a combination of the two.
While now is clearly not the best time to raise taxes (which could retard the already fragile recovery), eventually the Republicans and Democrats are going to have to act in the best interest of their country rather than their parties. And that means compromise.
Businesses are hoarding cash, suspending hires and delaying major investments. Why? Uncertainty. The most important thing the next President can bring to the economy is stable policy which will allow businesses to plan and invest with confidence.
Tempo Financial Advisors’ 3rd Quarter Investment Performance
I’ve written in the past how the Tempo Dynamic Programs generally don’t make as much in up markets but are less volatile and typically lose less (even sometimes gain) in the down markets. I thought I’d try something a little different this time.
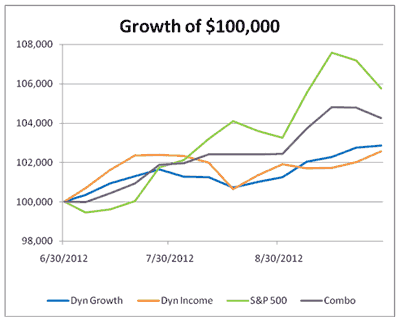
As the saying goes a picture is worth 1000 words. Below is chart showing the weekly results of $100k invested in the S&P 500, the Tempo Dynamic Growth Program, and the Tempo Dynamic Income Program in the third quarter.
Note at the beginning, middle, and end of the quarter when the market (green line) had some negative periods the Dynamic Programs (blue and orange lines) held up quite well. By contrast when the market made significant gains from mid July to mid August and in the first few weeks of September the Dynamic Programs trailed.
My favorite line on the chart is the purple line. This represents an investment of 25% Dynamic Income, 25% Dynamic Growth, and 50% S&P 500 and shows the benefit of diversification – smoother returns than the components while still capturing most of the upside.

For the quarter the Dynamic Growth and Dynamic Income Programs gained 2.7% and 2.5%, respectively. I am pleased with these results and the stability these strategies have shown throughout the year.
As you know Tempo does not merely invest in the S&P 500 but offers a much more diversified strategy called the Tempo Lifestyle Program. Portfolios are tailored to the client and could be aggressive (mostly stocks), moderate (majority of stocks and a larger allocation to bonds and alternatives), or conservative (a balance between stocks, bonds, and alternatives).
Thanks to stock exposure in general and to over-weighted positions in market segments that outperformed the overall market (technology, and financial), all Tempo Lifestyle accounts performed quite well in the third quarter. Returns ranged from 3.7% for conservative clients to 5% for more aggressive clients.
Notice the spread from conservative to aggressive was relatively small. The reason is bonds. You would expect a return of 1.6% for bonds (BarCap Aggregate Bond Index) to hinder performance for conservative accounts (given the higher allocation to bonds) when stocks perform so much better. But I have eschewed bonds such as the Bar Cap Agg and long term U.S. government bonds (+0.7%) in favor of bonds I felt offer better value such as high yield bonds (+4.3%) and world bonds (+4.5%).
Reminder
Please contact us if there has been a change in your financial circumstances that would warrant a fresh perspective on your portfolio.
Daniel J. Traub
